---
title: Performance Graph
description: Learn about the Performance Graph and how it can best be used to monitor your organization's performance over time
---
[Skip to content](https://help-legacy.corti.ai/migration/performance-graph#main-content)
English
Show submenu for translations
![Orb\_logotype\_horizontal\_white.png\]](https://help-legacy.corti.ai/hs-fs/hubfs/Orb_logotype_horizontal_white.png?height=40&name=Orb_logotype_horizontal_white.png)
- [Default HubSpot Blog](https://3997889.hs-sites.com/blog)
Open main navigation
Close main navigation
- [Default HubSpot Blog](https://3997889.hs-sites.com/blog)
- English
Show submenu for translations
- [Go to corti.ai](https://corti.ai/)
[Go to corti.ai](https://corti.ai/)
Welcome to Corti's Help Center
- There are no suggestions because the search field is empty.
1. [Help Center](https://help-legacy.corti.ai/migration?hsLang=en)
2. [User Guide](https://help-legacy.corti.ai/migration/user-guide?hsLang=en)
3. [Clear](https://help-legacy.corti.ai/migration/user-guide?hsLang=en#clear)
# Performance Graph
## Learn about the Performance Graph and how it can best be used to monitor your organization's performance over time
---
*written by: Christopher Jacko*
---
**Table of Contents**
[**Video Walkthrough**](https://help-legacy.corti.ai/migration/performance-graph#video_walkthrough)
1. [About the Performance Graph](https://help-legacy.corti.ai/migration/performance-graph#about)
2. [Related HOW-TOs](https://help-legacy.corti.ai/migration/performance-graph#how-tos)
### 1. About the Performance Graph
Powered by the **[Performance Score](https://help.corti.ai/performance-score?hsLang=en),** which is automatically generated by Corti for all calls, the **Performance Graph** tracks trends in individual, team and organization performance, providing an overview to identify if performance starts to slip. Whether it is a sudden drop or gradual deterioration in performance, you'll be the first to know.
The Performance Graph can be accessed from the individual, team and organization performance dashboards. Permissions for **Dashboard App** and **Team Performance App**are required to view the Performance Graph.
The chart is interactive and you can determine how the information is displayed by selecting[daily, weekly, or monthly averages.](https://help.corti.ai/how-to-plot-daily-weekly-or-monthly-averages-on-the-performance-graph?hsLang=en)
Across [Organization](https://help.corti.ai/how-to-visit-your-organizations-performance-dashboard?hsLang=en), [Team](https://help.corti.ai/how-to-visit-a-teams-performance-dashboard?hsLang=en) and [Individual](https://help.corti.ai/how-to-visit-a-users-performance-dashboard?hsLang=en) Dashboards you can use the filter option to determine the [date](https://help.corti.ai/how-to-filter-calls-by-date-and-time-on-the-performance-dashboard?hsLang=en) range or [protocol](https://help.corti.ai/how-to-filter-calls-by-protocol-in-the-performance-dashboard?hsLang=en) of the calls displayed on the graph.
This way, you can get a broad overview of trends for the quarter or the year, and then zoom in on specific months which may be affecting the average. You can easily determine if poor performance is impacted by specific types of calls or users, flagging potential burnout and allowing for targeted training.
- Corti measures the performance on every single consultation rather than just a sample, so you can be confident that it's a real trend and not just a fluctuation. By measuring the entire population, you avoid sampling bias and ensure statistical significance.
- Performance is being measured continuously, so you don't need to wait weeks to confirm the trend and take action.
- The same chart is provided for each individual call-taker to help you monitor and figure out exactly why or how performance has dropped. This empowers you to take action before it becomes a serious problem and gives you the tools to measure the improvements afterward.
*click\_to\_expand*[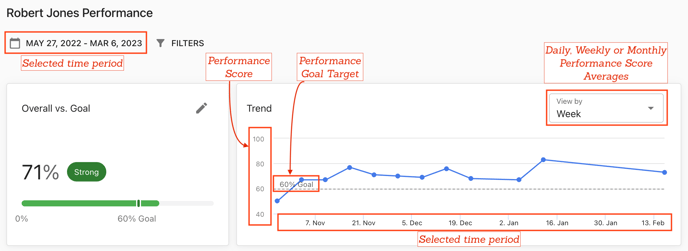](https://help-legacy.corti.ai/hubfs/Performance%20Graph_img.png?hsLang=en)
### 2. Related HOW-TOs
*[How to visit an organization's Performance Dashboard](https://help.corti.ai/how-to-visit-your-organizations-performance-dashboard?hsLang=en)*
*[How to visit a team's Performance Dashboard](https://help.corti.ai/how-to-visit-a-teams-performance-dashboard?hsLang=en)*
*[How to visit a user's Performance Dashboard](https://help.corti.ai/how-to-visit-a-users-performance-dashboard?hsLang=en)*
*[How to set and adjust the Performance Goal](https://help.corti.ai/how-to-set-and-adjust-the-performance-goal?hsLang=en)*
*[How to plot daily, weekly or monthly averages on the Performance Graph](https://help.corti.ai/how-to-plot-daily-weekly-or-monthly-averages-on-the-performance-graph?hsLang=en)*
*[How to filter calls by date in the Performance Dashboard](https://help.corti.ai/how-to-filter-calls-by-date-and-time-on-the-performance-dashboard?hsLang=en)*
[*How to filter by call protocol in the Performance Dashboard*](https://help.corti.ai/how-to-filter-calls-by-protocol-in-the-performance-dashboard?hsLang=en)
---
*revised: March 06, 2023*
- [New to Corti?](https://help-legacy.corti.ai/migration/new-to-corti?hsLang=en#main-content)
- [Technical Set-Up](https://help-legacy.corti.ai/migration/new-to-corti?hsLang=en#technical-set-up)
- [Implementing Clear/Voyager AI - Call Recorder Integration](https://help-legacy.corti.ai/migration/new-to-corti?hsLang=en#implementing-clear-voyager-ai-call-recorder-integration)
- [Implementing Clear/Voyager AI - CAD Integration](https://help-legacy.corti.ai/migration/new-to-corti?hsLang=en#implementing-clear-voyager-ai-cad-integration)
- [How To's](https://help-legacy.corti.ai/migration/how-tos?hsLang=en#main-content)
- [Clear/Voyager AI Videos](https://help-legacy.corti.ai/migration/how-tos?hsLang=en#clear-voyager-ai-videos)
- [Clear/Voyager AI - Explore - Articles](https://help-legacy.corti.ai/migration/how-tos?hsLang=en#clear-voyager-ai-explore-articles)
- [Clear/Voyager AI - Call Review - Articles](https://help-legacy.corti.ai/migration/how-tos?hsLang=en#clear-voyager-ai-call-review-articles)
- [Clear/Voyager AI - Call Search - Articles](https://help-legacy.corti.ai/migration/how-tos?hsLang=en#clear-voyager-ai-call-search-articles)
- [Engage - Protocol Editor Videos](https://help-legacy.corti.ai/migration/how-tos?hsLang=en#engage-protocol-editor-videos)
- [Engage - Protocol Editor Articles](https://help-legacy.corti.ai/migration/how-tos?hsLang=en#engage-protocol-editor-articles)
- [Admin - Articles](https://help-legacy.corti.ai/migration/how-tos?hsLang=en#admin-articles)
- [Clear/Reviews](https://help-legacy.corti.ai/migration/how-tos?hsLang=en#clear-reviews)
- [User Guide](https://help-legacy.corti.ai/migration/user-guide?hsLang=en#main-content)
- [Engage](https://help-legacy.corti.ai/migration/user-guide?hsLang=en#engage)
- [Clear](https://help-legacy.corti.ai/migration/user-guide?hsLang=en#clear)
- [General Platform](https://help-legacy.corti.ai/migration/user-guide?hsLang=en#general-platform)
- [Deep Dive Repository](https://help-legacy.corti.ai/migration/user-guide?hsLang=en#deep-dive-repository)
- [What's new?](https://help-legacy.corti.ai/migration/whats-new?hsLang=en#main-content)
- [Release Notes 2024](https://help-legacy.corti.ai/migration/whats-new?hsLang=en#release-notes-2024)
- [Release notes 2023](https://help-legacy.corti.ai/migration/whats-new?hsLang=en#release-notes-2023)
- [Corti Co-Pilot](https://help-legacy.corti.ai/migration/corti-co-pilot?hsLang=en)
- [Default HubSpot Blog](https://3997889.hs-sites.com/blog)
[](https://help-legacy.corti.ai/?hsLang=en)
Can't find what you need? Reach out through https://corti.zendesk.com/hc/en-us
Copyright © 2026, Corti
```json
{
"@context" : "https://schema.org",
"@type" : "VideoObject",
"contentUrl" : "https://3997889.fs1.hubspotusercontent-na1.net/hubfs/3997889/Video%20Walkthroughs/Performance%20Graph.mp4",
"dateModified" : "2023-03-06T12:13:29.713Z",
"duration" : "PT1M55.52S",
"height" : 1080,
"name" : "Performance Graph",
"thumbnailUrl" : "https://3997889.fs1.hubspotusercontent-na1.net/hubfs/3997889/Video%20Walkthroughs/Performance%20Graph.mp4/medium.jpg",
"uploadDate" : "2023-03-06T12:05:27.875Z",
"width" : 1920
}
```